We don't always have equivalent datasets for both sides of the Powys / Herefordshire border: if there's a potential pollution source type on one side of the border and not the other that doesn't mean that there aren't any instances, it's just we don't necessarily have the data. Maybe you can help?
The Powys Poultry Shed data and Pig Shed data (data as at March 2021), and the Biomass Plant data (as at April 2021) has been obtained via Powys County Council (PCC) Planning Portal. The Powys Anaerobic Digester (AD) data has been obtained partly from PCC Planning Portal and partly from www.r-e-a.net/resources/uk-anaerobic-digestion-sites-map/ (retrieved April 2021). Some of the positions of the ADs and Biomass Plant have been determined from the Post Code given in their Planning Applications as the actual location was not specified, hence these are approximate positions.
The Herefordshire Poultry Shed data (at May 2021) is provided courtesy of Dr. Alison Caffyn, Cardiff University, derived by her from the Herefordshire County Council Planning Portal and Environmental Permit records.
Other data sources used are Dwr Cymru / Welsh Water, Natural Resources Wales and Environment Agency.
The Intensive Pig Units and the Biomass Burners that are overlaid with a question mark are believed by us to be operating Pig and Biomass units.
Please notify us of any errors or omissions.
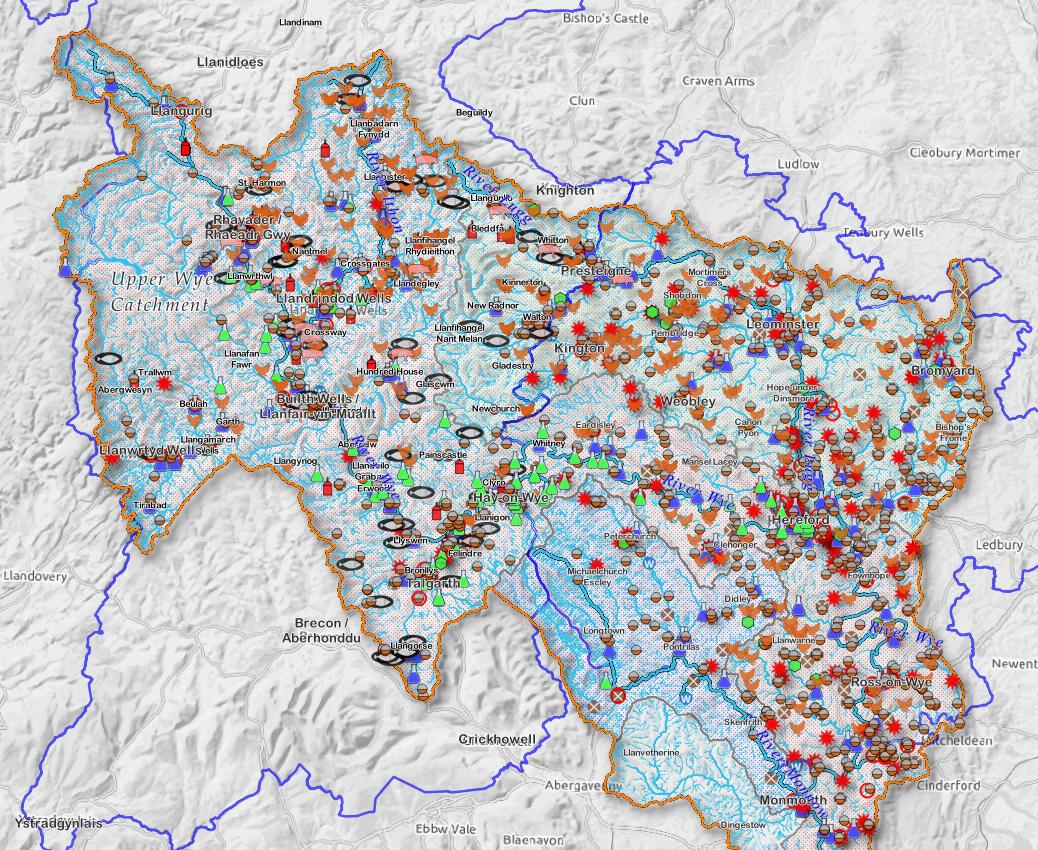
The Upper Wye Catchment shown here consists of i) the 3 Wye Operational Catchments (OpCats), ii) the Irfon and iii) the Ithon OpCats. The Lugg Catchment consists of i) the Lugg OpCat and ii) the Arrow, Lugg and Frome OpCat. And the Monnow is its own OpCat.
This summary is solely of the data in those areas of the two counties that lie within the Wye Management Catchment, i.e. that bordered with the orange line:
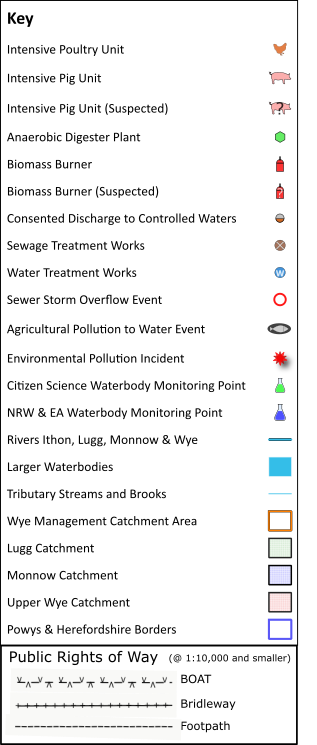
- Intensive Poultry Units (around 140 in Powys and 124 in Herefordshire), Pig Units (13 in Powys), Anaerobic Digesters (3 in Powys, 16 in Herefordshire) and Biomass Burners (31 in Powys). These are the units that we believe are currently in operation.
- Consented Discharge Points to Controlled Waters: these are "permits", all currently valid; 259 Discharge Points in the Powys part of the catchment and 463 in the Herefordshire end.
- Agricultural Pollution to Water Events (Powys): 53 substantiated events; range from 2010 to 2021.
- Environmental Pollution Incidents: Powys 21, range 2016 - 2020; and Herefordshire 117, range 2001 - 2021.
- NRW Monitoring Points: 83; those planned for monitoring in 2021. EA Monitoring Points: 91; these are the actual points that were used for 2020.
- Sewage and Water Treatment Works: 156 STWs and 11 WTWs across the two counties.
- Sewer Storm Overflow Events: 107 across the two counties; records for 2020 only.
The Citizen Science Monitoring Points currently shown are the planned points (as at late May 2021) for the Friends of the Upper Wye partners in the Project (www.fouw.org.uk). Additional Citizen Science monitoring points will be added to the maps in due course, as the project develops.
Zoom in and out of the map detail using either the +/- in the top left corner of the map, or the mouse wheel, or equivalent on your touchpad.
As there is a huge amount of data to display, to avoid cluttering the interactive map the initial presentation has been simplified slightly; however more icons will become visible in your area of interest as you zoom in further and further. (See Figure 2 below for a static base map snapshot of the full set of initial data, which will gradually then become visible as you zoom in below.)
Left click and drag to move around the map. (The whole map may not appear at first in the window on your device so you may need to drag it around a bit to view all.)
The blue icon top right is the Legend where you can switch the various layers of the map on and off to tailor it for your needs. You can also change the base map here to a satellite, or aerial, view.
Click on an icon for a pop-up description. If part of it disappears outside the map border zoom in a bit and / or drag the map around.
The Powys Public Rights of Way (PRoWs) disappear if you zoom in to a scale of 1:10,000 or greater. (We don't yet have the Herefordshire PRoWs available.)
For simplification, not all the smaller watercourses are shown on the interactive map below. To download a high resolution PDF map containing all the essential detail, including smaller watercourses and supporting notes, click here, or on the static base map in Figure 2 below. The PDF map is designed for printing at A2 so you can zoom in a long way for the topographic detail.
Maps © Brecon & Radnor Branch of Campaign for the Protection of Rural Wales 2021 and © Herefordshire Campaign to Protect Rural England 2021.
Contains OS and Environment Agency data © Crown copyright and database right 2021.
Contains Dwr Cymru / Welsh Water and Natural Resources Wales information © Natural Resources Wales and Database Right. All rights Reserved.
Powys Public Rights of Way from Powys County Council WMS.
Base maps: © OpenStreetMap Contributors, © Thunderforest and satellite / aerial view © 2021 Google.
[Updated June 2021 [HCPRE Logo minor update September 2021]]