Herefordshire, Shropshire & Powys: Intensive Poultry Units 3 Counties Map
Background
Environmental organisations are concerned by the growth and proliferation of Intensive Livestock Units (ILUs) within the UK and elsewhere, particularly the impacts of ammonia, nitrogen deposition and phosphates on biodiversity and human health, and the consequent deterioration of rural living conditions and our treasured rural landscapes.
Their concerns include, but are not limited to:
• pollution of water such as streams, rivers and ponds, affecting freshwater ecosystems;
• impacts of ammonia emissions on lower plants and plant diversity, and the resulting damage to ecosystems including those within Sites of Special Scientific Interest, Ancient Woodland and other designated nature sites;
• air pollution affecting our own health;
• foul odours and heavy traffic on narrow rural lanes;
• the impacts of industrial-scale development on rural landscapes, including those designated as Areas of Outstanding Natural Beauty and National Parks.
This is a problem which knows no borders, and especially as the headwaters of a couple of Britain’s iconic rivers – the Wye and the Severn – lie in Powys.
There have been a number of articles in the press recently discussing these issues. Some external links are given below.
In Spring 2019 four of the NGOs who have these concerns met in Shropshire to discuss the issue. These organisations were the Herefordshire and Shropshire branches of Campaign for the Protection of Rural England (CPRE), Shropshire Wildlife Trust (SWT) and us, the Brecon & Radnor branch of Campaign for the Protection of Rural Wales (CPRW).
At the meeting we discussed our common concerns with ILUs but focussing on Intensive Poultry Units (IPUs), particularly Intensive Chicken Units, which are becoming very widespread throughout Herefordshire, Shropshire and Powys.
CPRW already have a database of IPUs in Powys and have published the maps on this website illustrating the issue in the county. The two CPREs and SWT also have been developing a comprehensive record of IPUs in their own counties.
It was agreed at the meeting to form a combined CPRE/SWT/CPRW team to rationalise and consolidate the various IPU datasets across the counties, and to build on CPRW’s work by developing some combined maps from this data to illustrate the IPU issues across the three counties.
Therefore here are our first combined cross-border IPU maps, with data to hand as at July 2019.
If you click on a map it will open a PDF version of the map in a new window. Alternatively you can right-click on a map and “Save Target As” or equivalent to download the PDF.
Maps
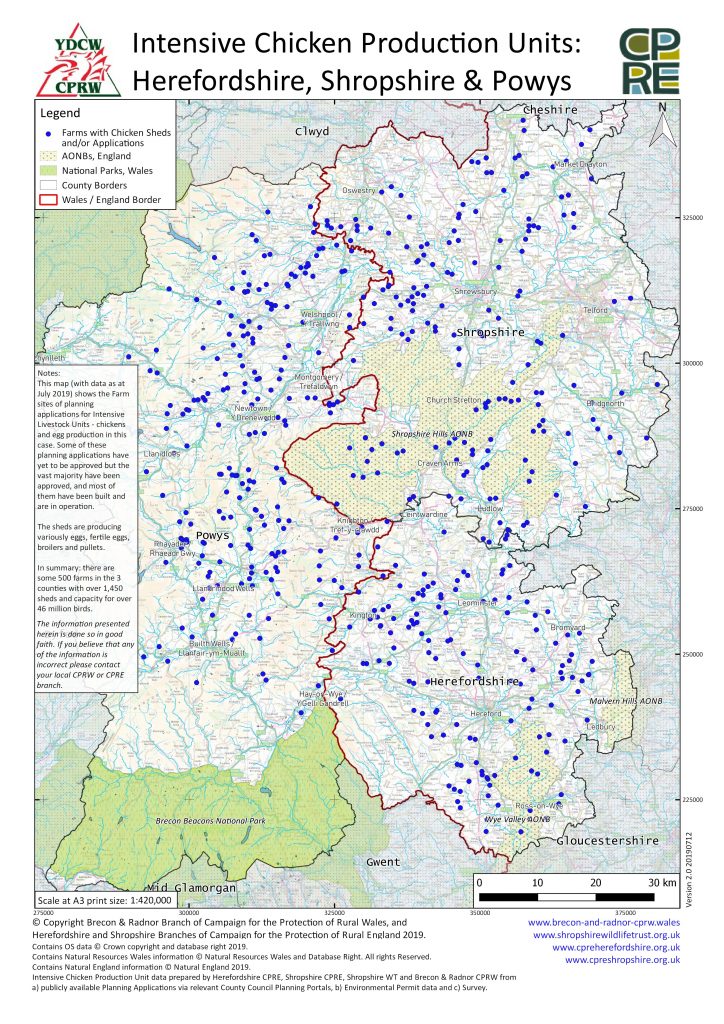
This one shows the number and extent of the farms with IPUs (that we have records for) across the 3 counties.
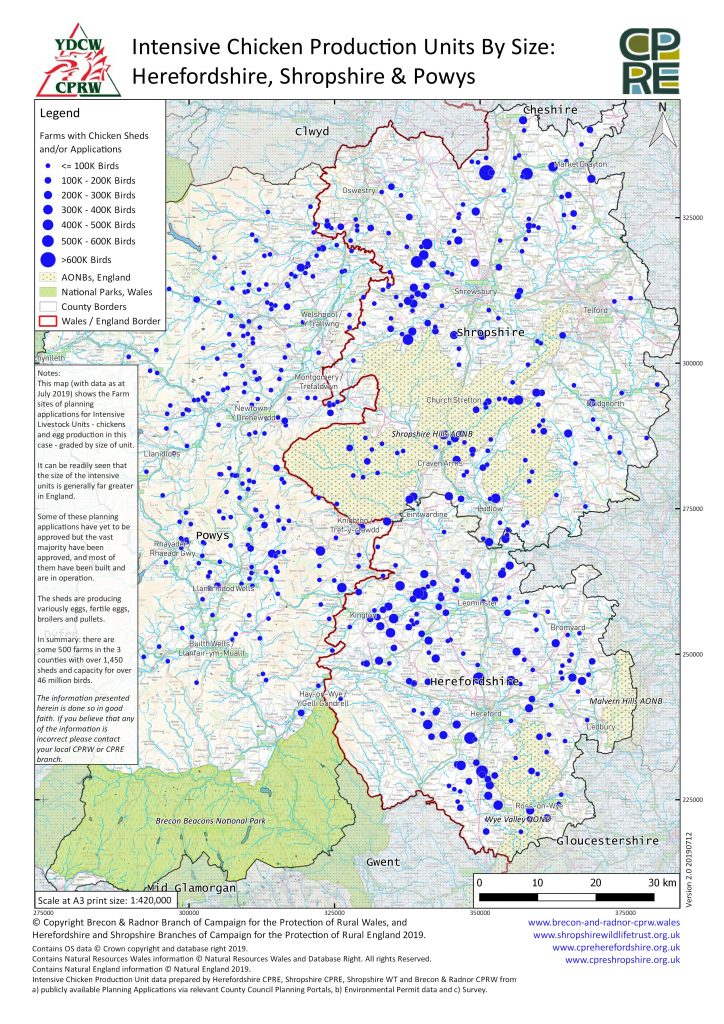
This following one is similar to that above but it scales the farm icon according to the size of the IPU on the farm. The number of chickens on a farm varies from several thousand on the smaller units up to several hundreds of thousand chickens on the larger ones, with over 1 million birds on one farm. According to our combined records in the 3 counties there are some 500 farms with over 1,450 sheds and a total of over 45 million birds. That’s a lot of chicken poop to dispose of!
There are also three similar maps to that above available at a larger scale of the individual counties available here:
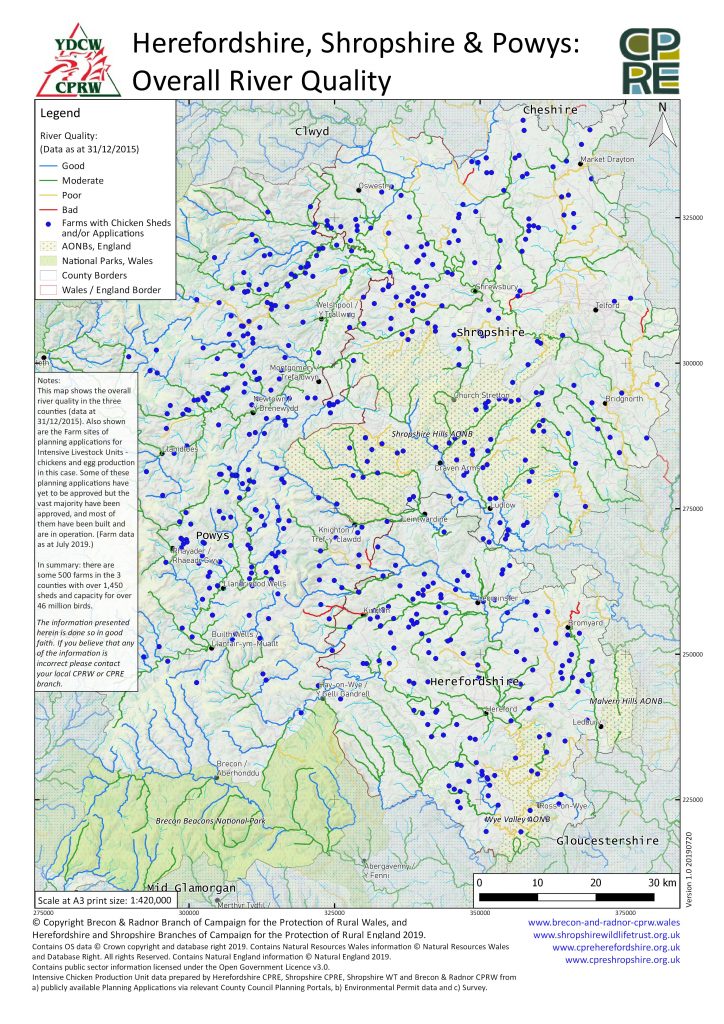
This map gives a summary of the quality of our rivers in the three counties, along with the IPUs shown as in the first map:
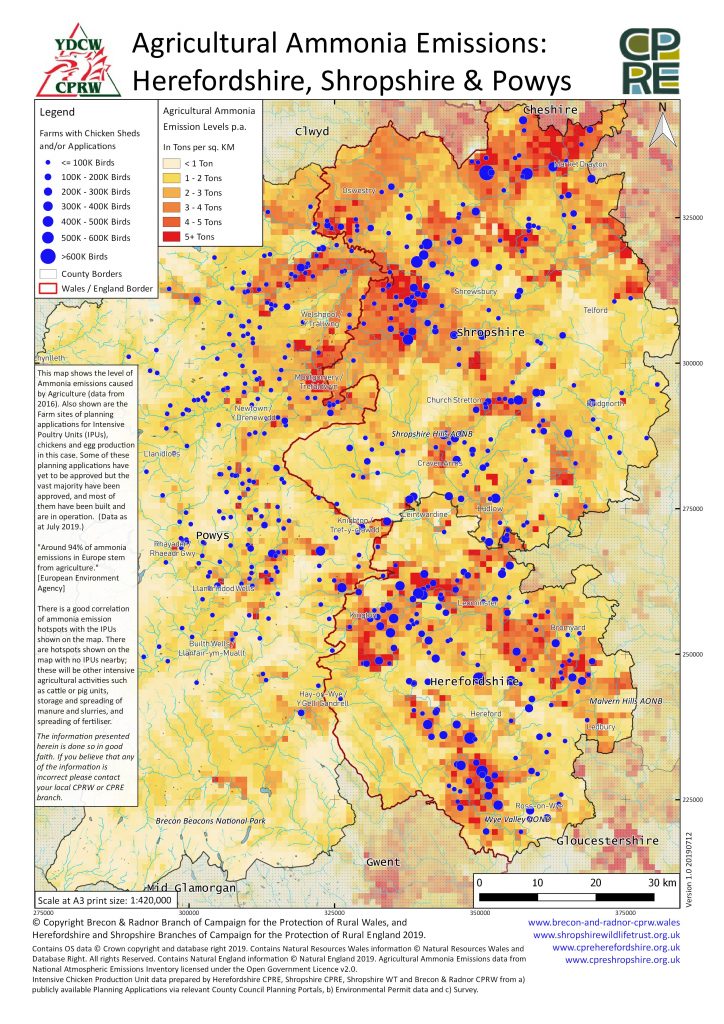
This one shows a good correlation between the IPUs and Agricultural Ammonia “hotspots” in the counties:
The final one is an interactive map similar to our own Powys Chicken Sheds map. You can zoom in and drag the map around, and click on an icon for further information on the farm. The icons in the title bar of the map provide further options and information. A larger version of the map may be viewed in Google by clicking here.
If you click on the square greenish icon lower left on the Menu Bar – the leftmost icon on the Title Bar will show it – the base map goes to aerial view. You can then zoom in on specific farm icons and in, most cases, see the shed(s) on the farm. Also the outdoor chicken runs are visible on some of the farms. (It is important to note that the aerial imagery, Google, is several years old in many cases and so the image may not reflect the actual current state of the farm.)
The information presented on these maps is done so in good faith. If you believe that any of the information is incorrect please contact your local CPRW or CPRE branch.
External Links:
Ammonia pollution damaging more than 60% of UK land – report
Testing reveals ammonia pollutant hotspots at UK farms
Dealing with ammonia is an urgent health problem – yet levels are still rising
Revealed: UK government failing to tackle rise of serious air pollutant
Published July 2019