Maps From Our Representation For Hearing Session 1
Powys LDP – Maps From Our Representation For Hearing Session 1
As part of the evidence submitted by National CPRW to Powys County Council (PCC), Brecon & Radnor Branch produced a set of maps illustrating problems we see with the currently proposed Renewable Energy (RE) policy section of the LDP.
It is important to note that Powys County Council (PCC) and their Consultants are currently revising the RE policy (see our Post here) due to the concern of many many Powys residents. Therefore the maps presented here are relevant to the proposed policy PCC published for consultation late last year. Of course, CPRW will be looking at Powys’ revised RE policy proposals – due in early May 2017 – and will be assessing the likely impact of those in a similar manner.
Some notes on the maps are presented below. There are further notes embedded on the maps themselves. Full size versions of these maps (large downloads) are available from here.
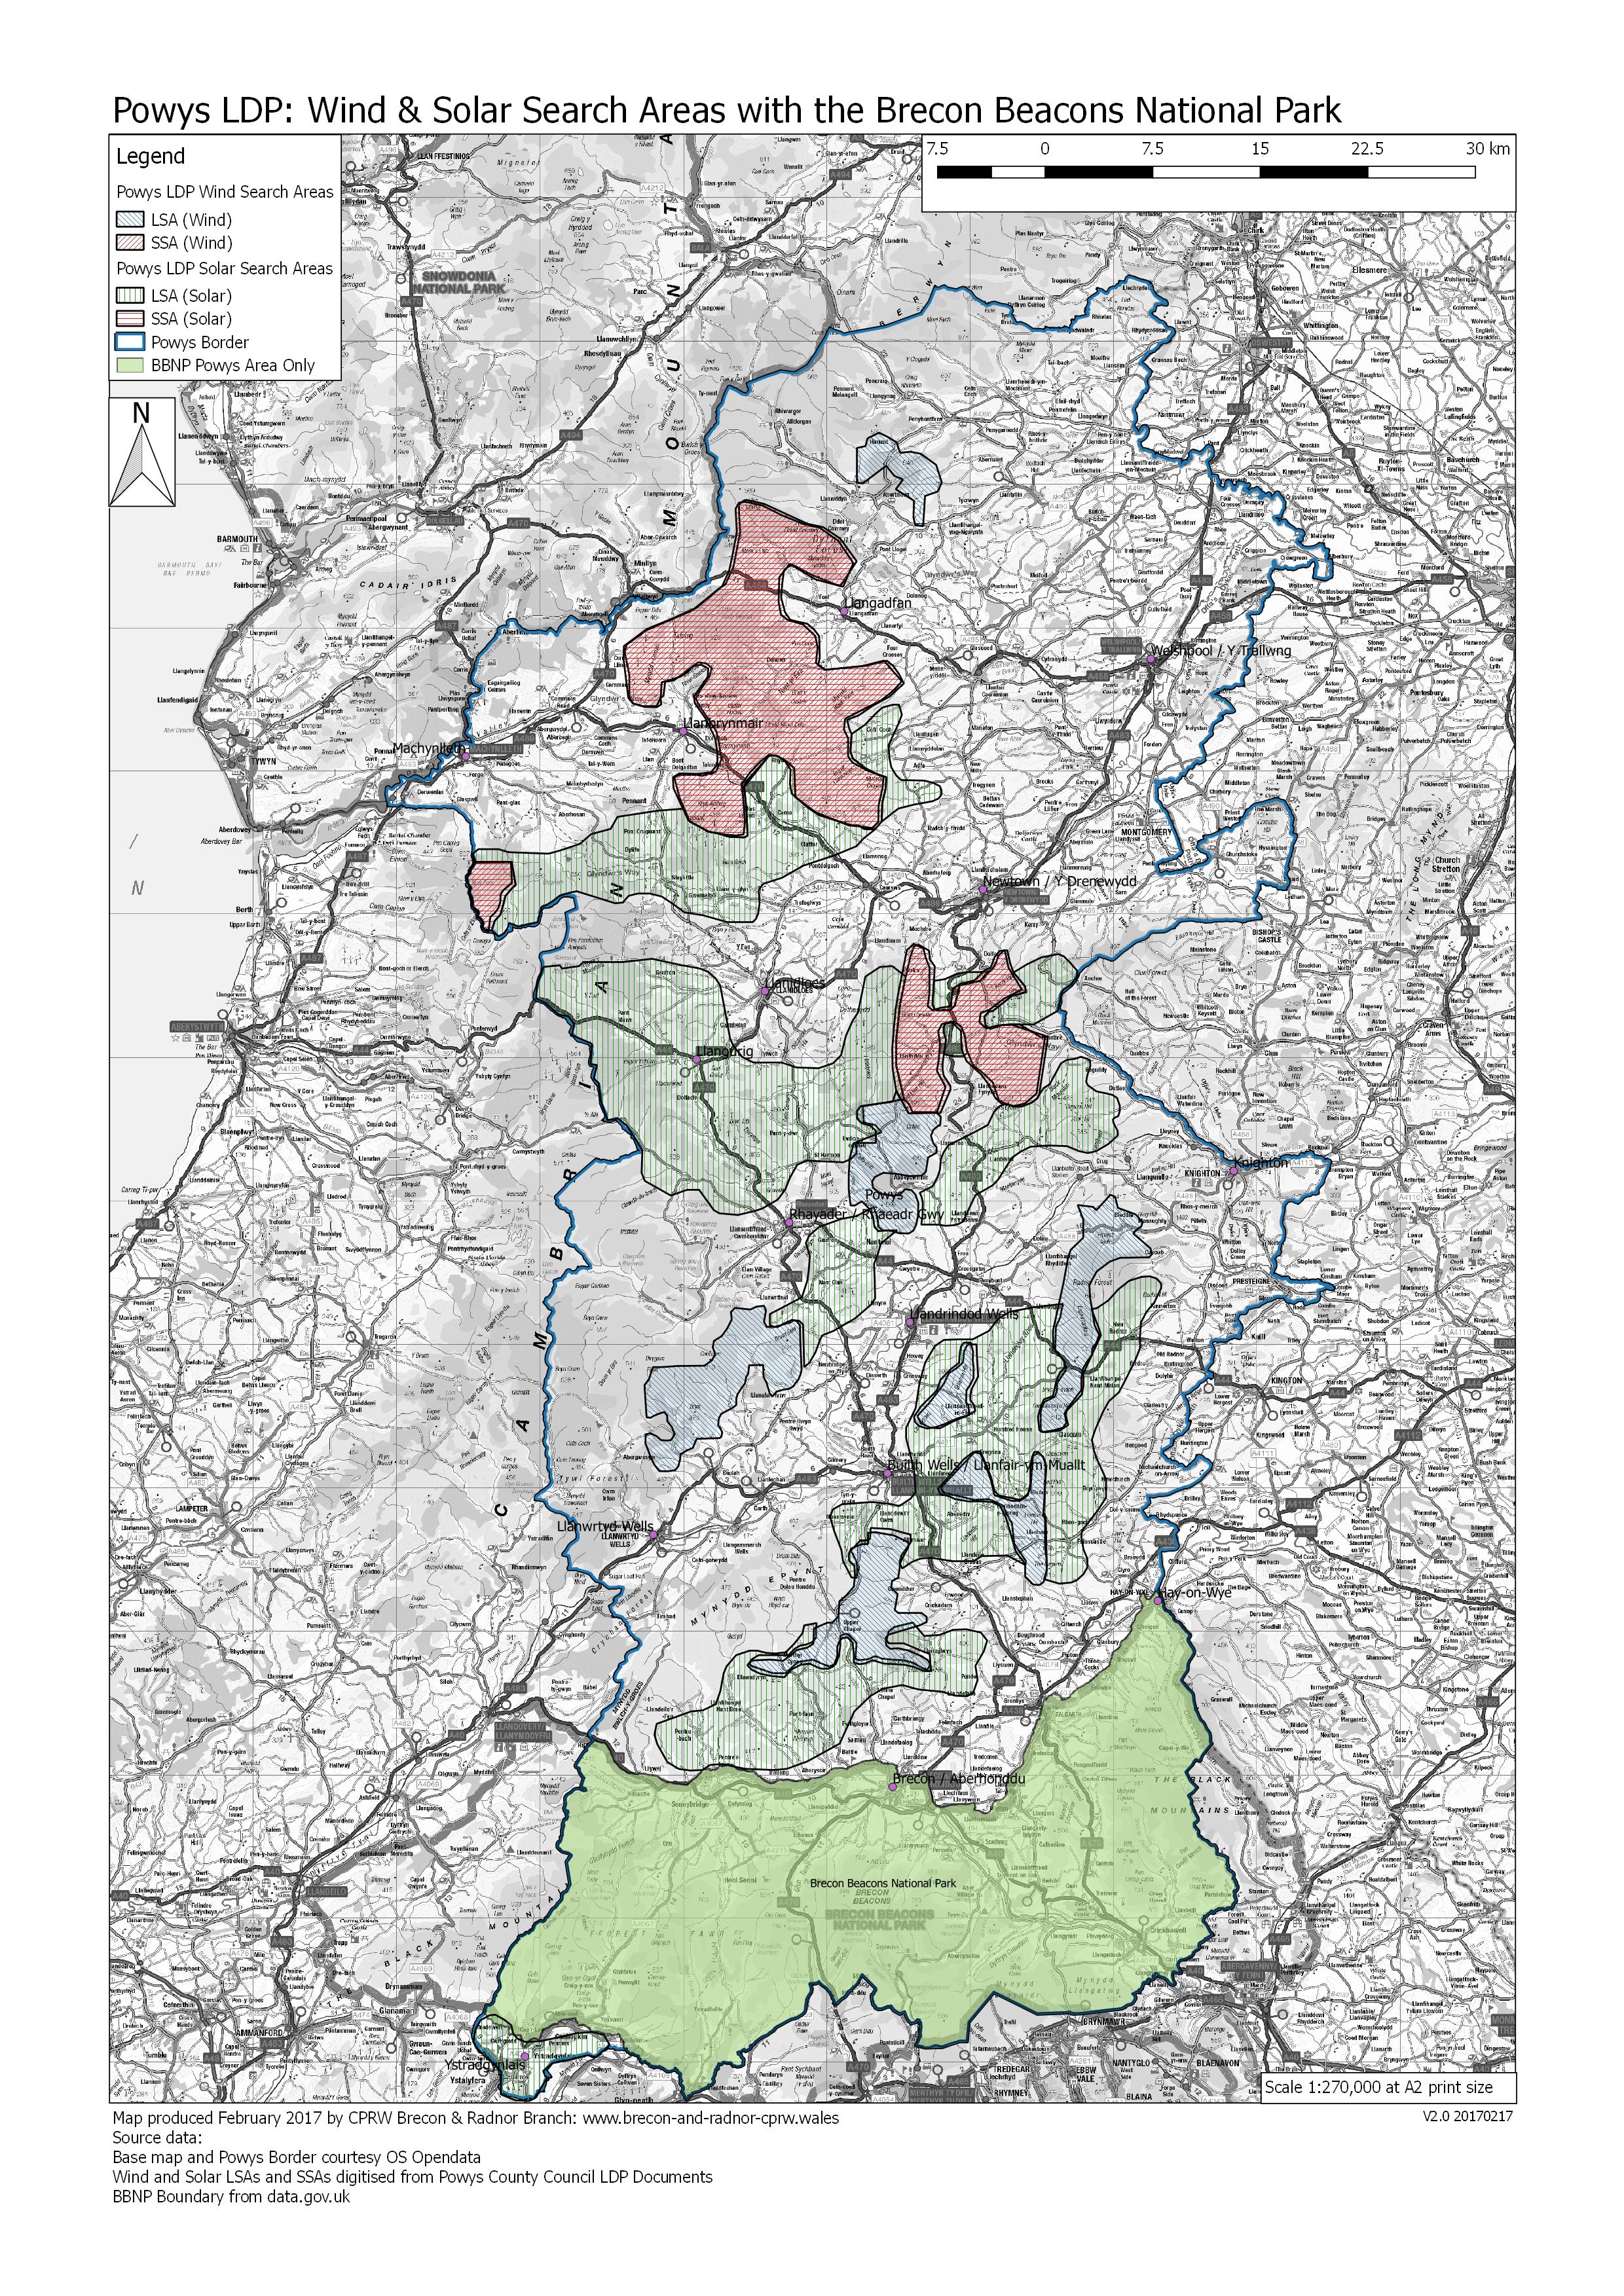
Map 1: Powys LDP area: Proposed Wind & Solar Local Search Areas in relation to the Brecon Beacons National Park
Map 1 illustrates the location of the proposed Wind and Solar LSAs. Collectively these areas represent the equivalent of almost 26% of the total land area of Powys outside the Brecon Beacons National Park. If the existing Strategic Search Areas are included this figure increases to 32.4%.
NOTE: The area of the Brecon Beacons National Park (BBNP) shown on all these maps is just that contained solely within Powys.
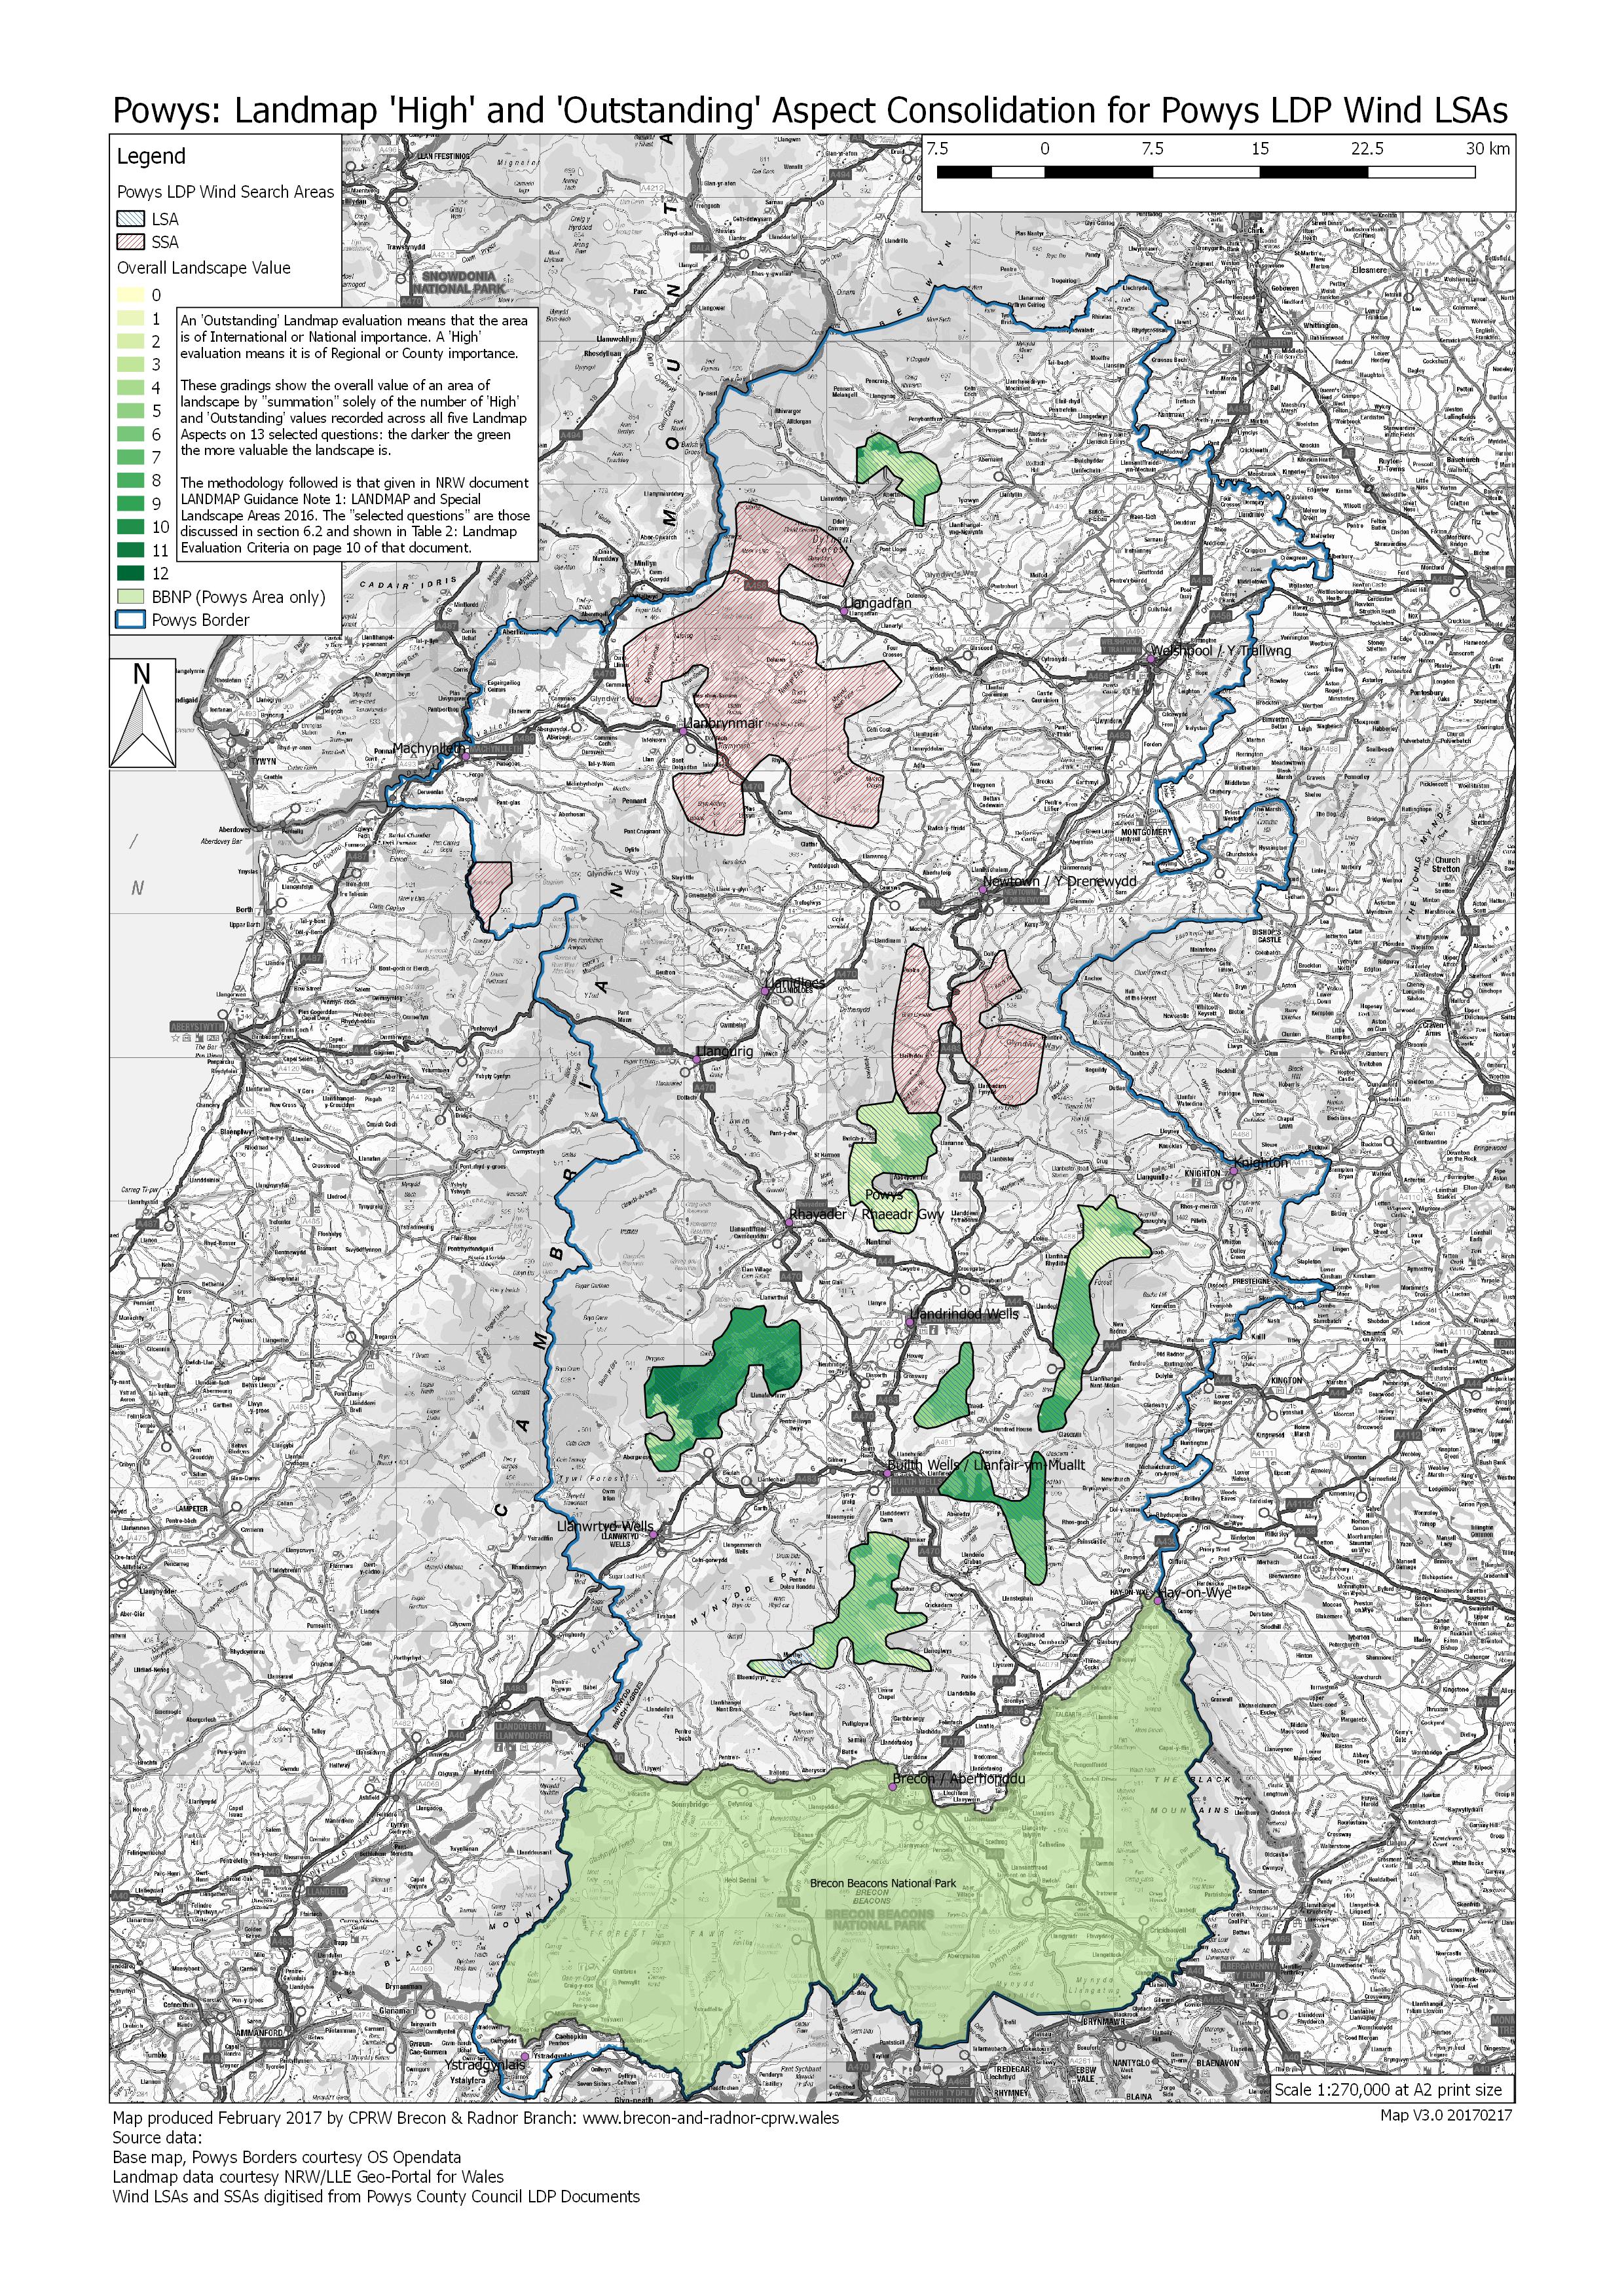
Map 2 Powys LDP Area: Consolidation of LANDMAP ‘High’ & ‘Outstanding’ Aspect areas for the proposed Wind LSAs
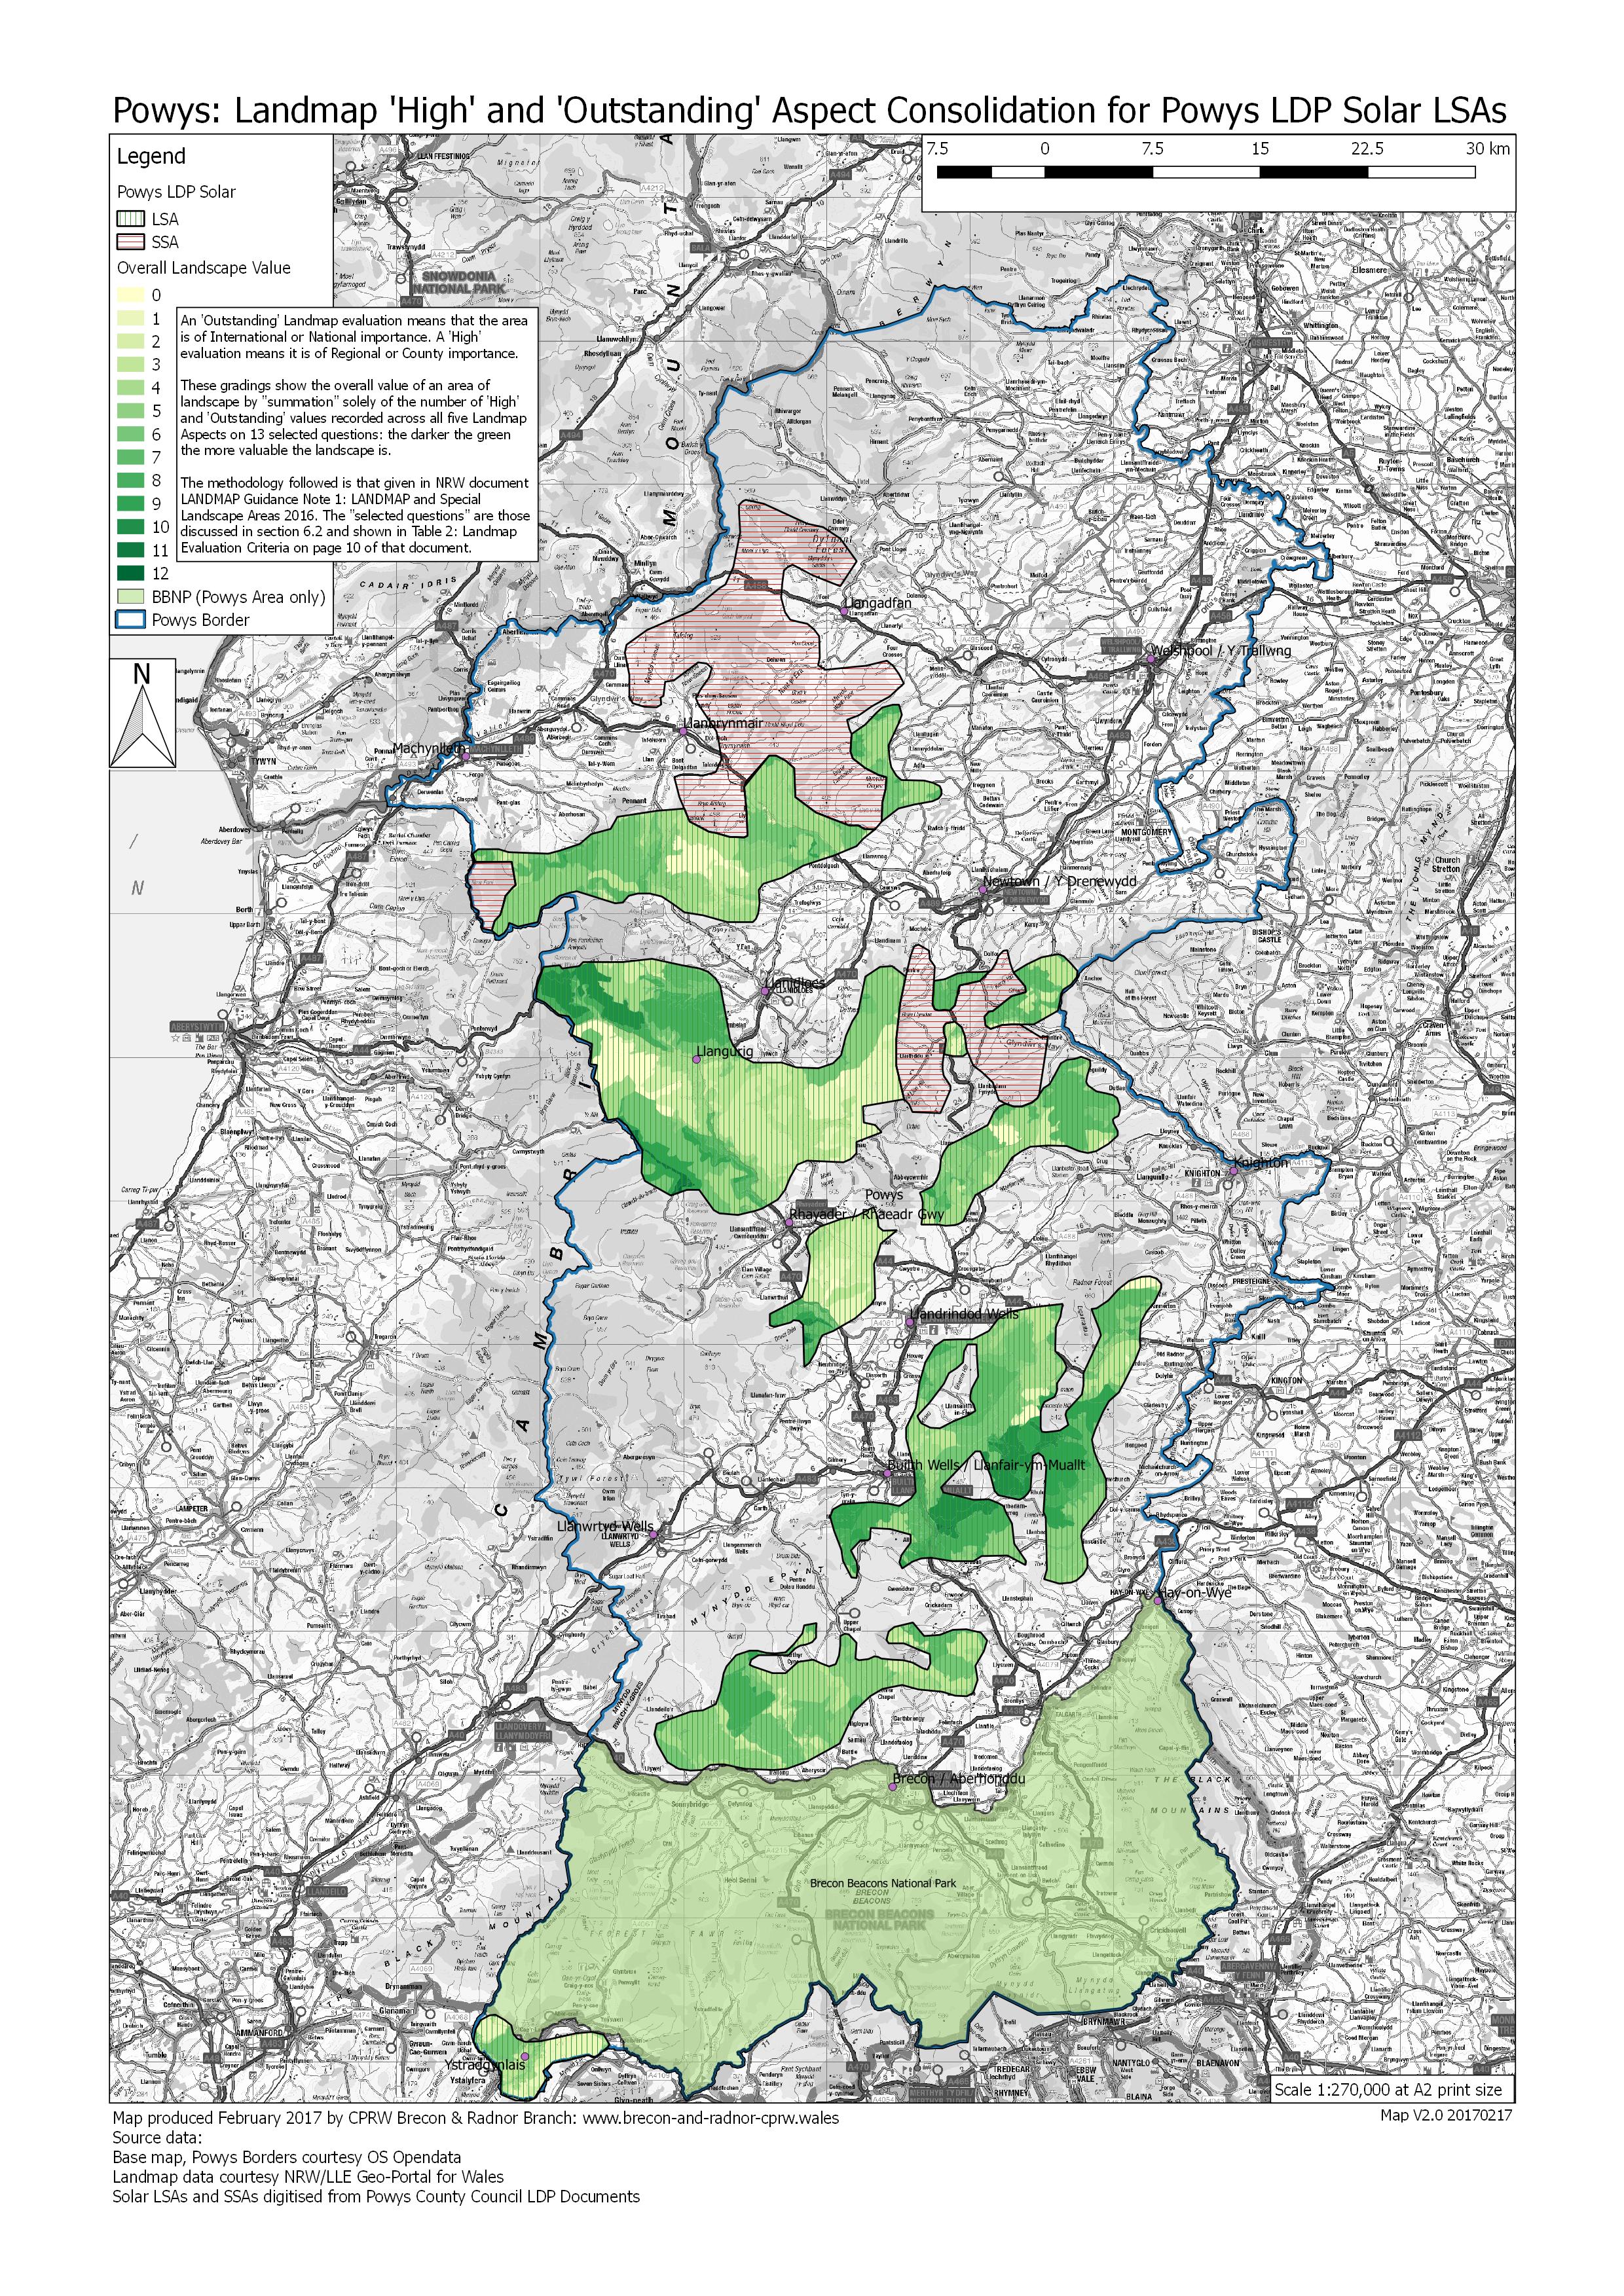
Map 2 and Map 3 demonstrate the implications of the LSAs on their respective landscapes.
Each of the five LANDMAP Aspects layers is represented on the maps, namely: Geological Landscape, Historic Landscape, Landscape Habitats, Cultural Landscape, and Visual & Sensory.
However only those LANDMAP areas classified as Outstanding (International or National importance) or High (Regional or County importance) value have been plotted or analysed from each of these five LANDMAP Aspects.
In addition only those LANDMAP criteria identified in National Resources Wales (NRW) approved Guidance for the initial identification of areas suitable for consideration as Special Landscape Areas, are used to determine the significance of the landscape character of each of the proposed LSAs.
Each map therefore illustrates for any given LSA, the “summation” across all the five LANDMAP Aspects of those values recognised as being either ‘Outstanding’ and ‘High’ for the 13 criteria questions recognised by NRW as the important indicators for assessing a landscape’s overall significance.
The eventual intensity of the colour coded rendering on Maps 2 and 3 therefore represents the cumulative classification of this LANDMAP data. For clarity of interpretation, the darker the green colouring on these maps the more valuable the LANDMAP data considers the landscape of that area to be, when measured across all the Aspects using these benchmark criteria.
Map 3 Powys LDP Area: Consolidation of LANDMAP ‘High’ & ‘Outstanding’ Aspect areas for proposed Solar LSAs
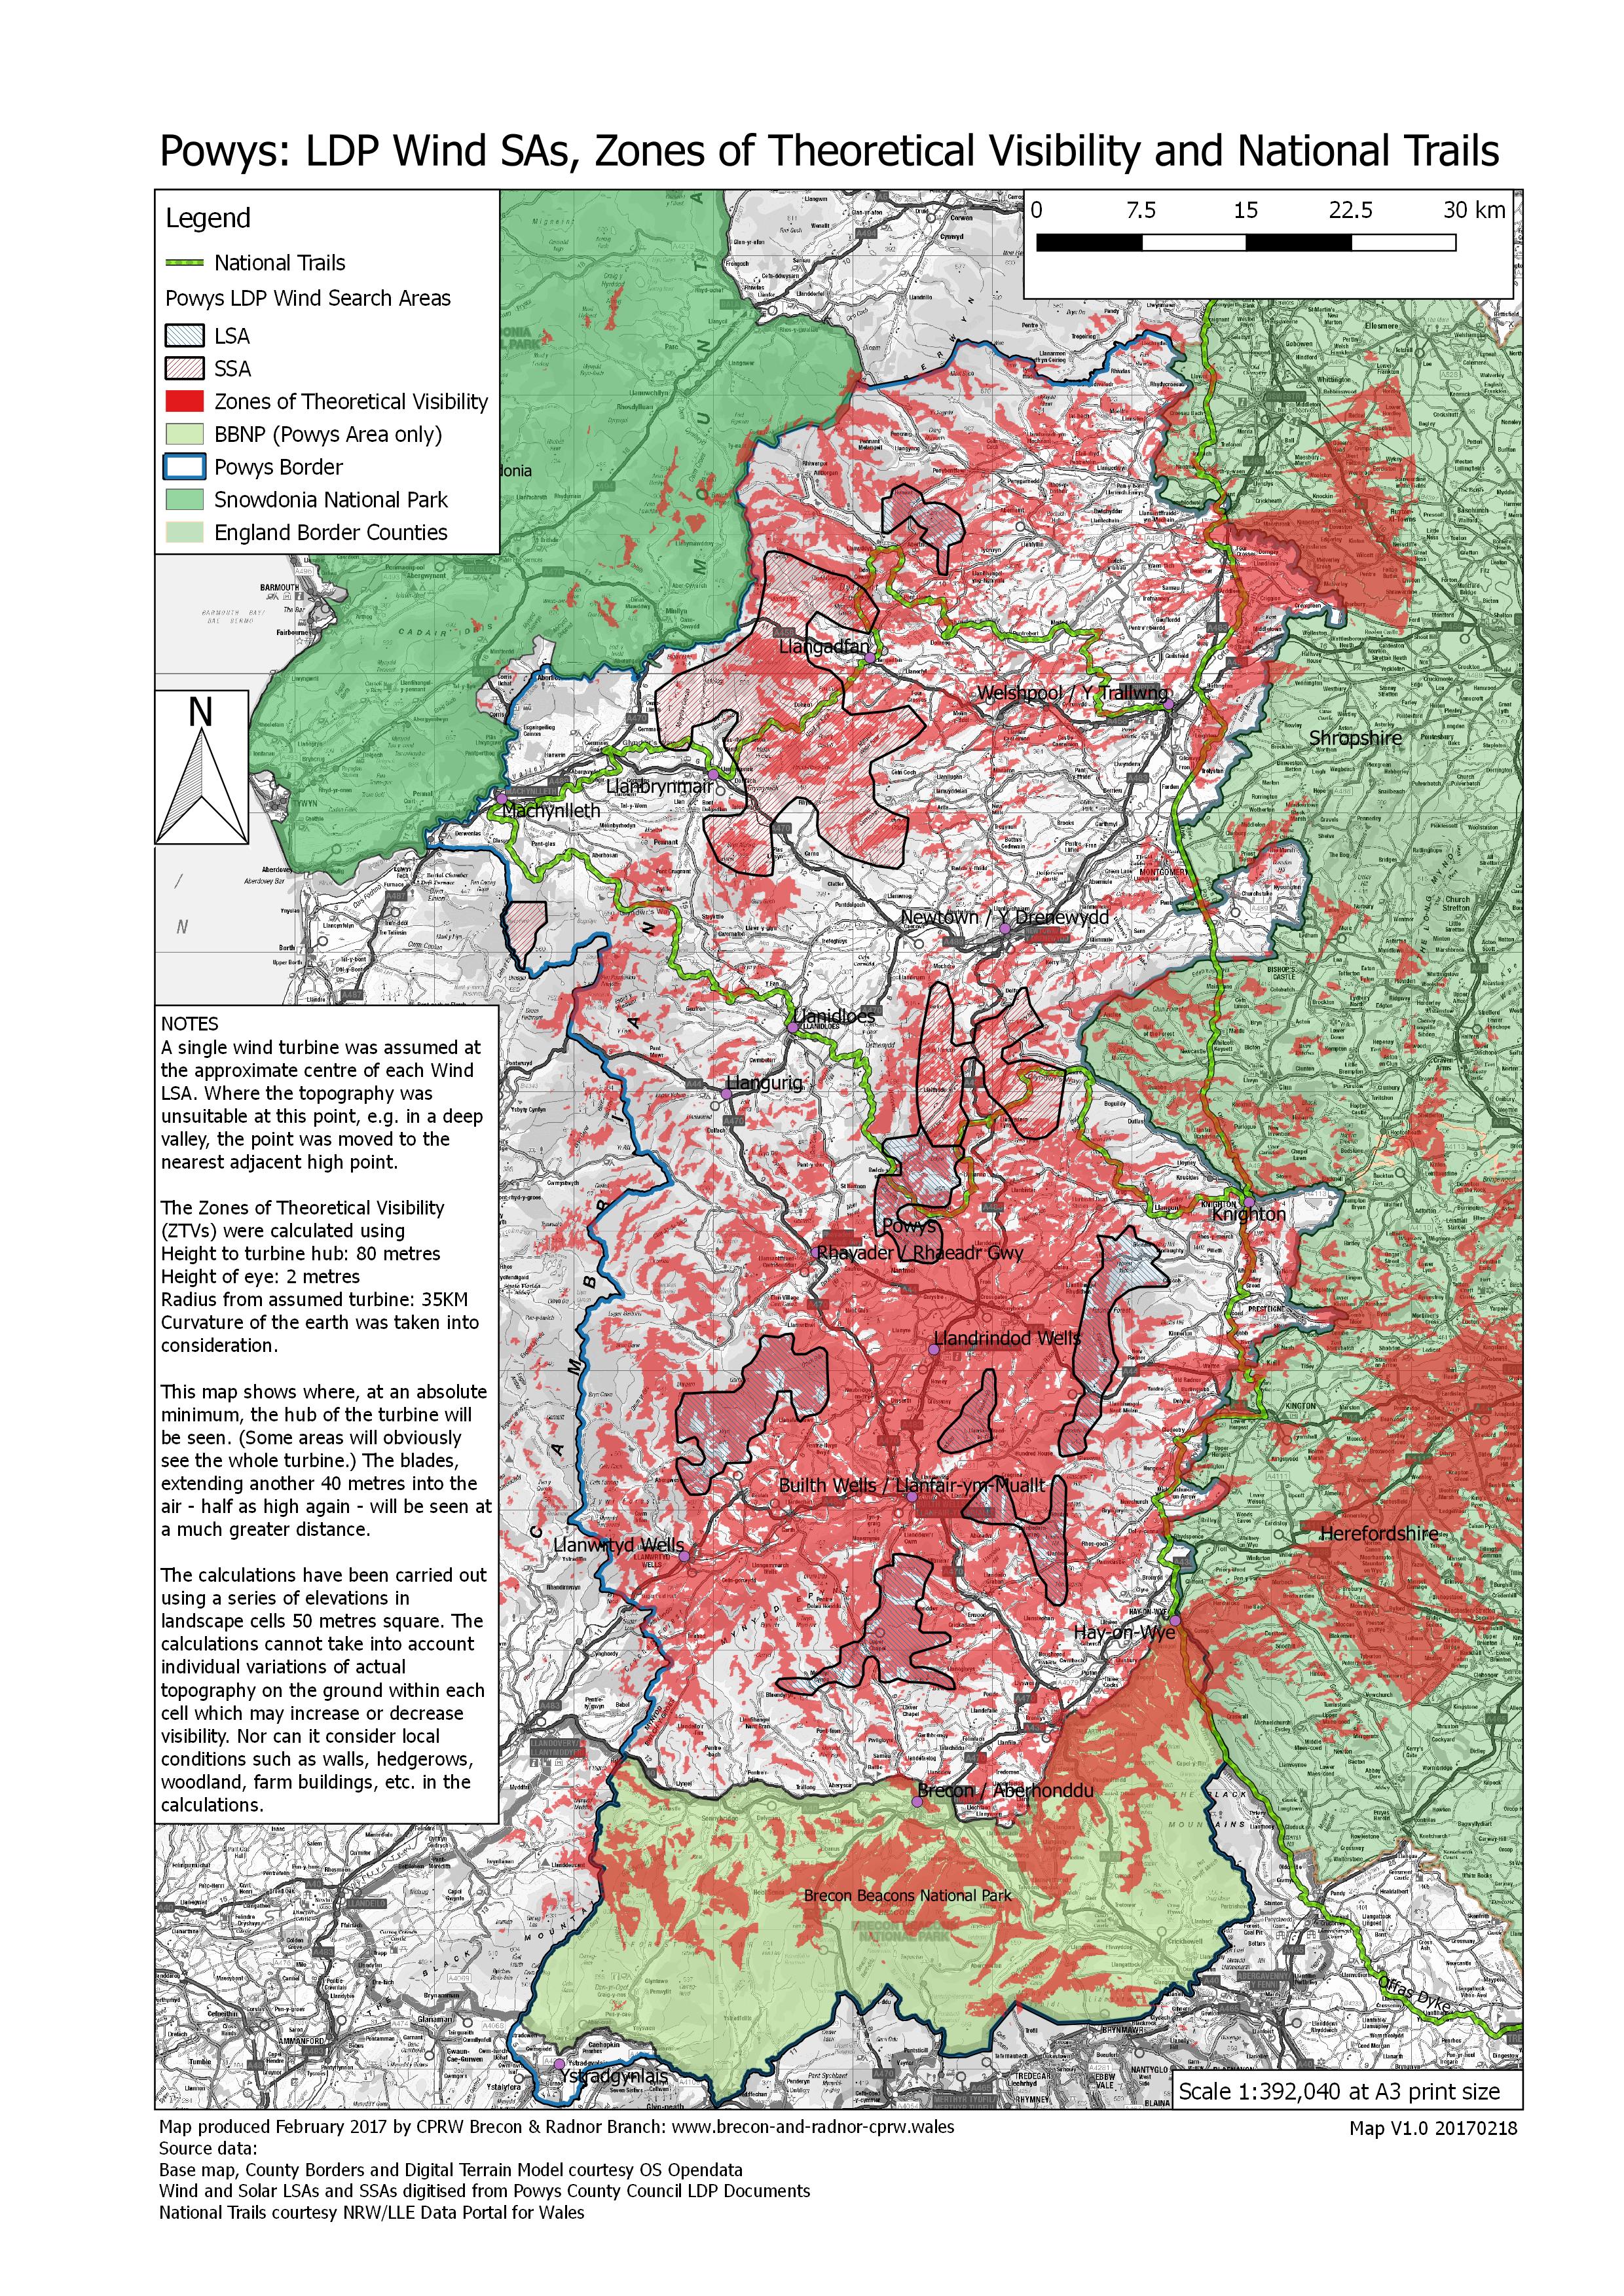
Map 4 Powys LDP Area: Wind SAs, Zones of Theoretical Visibility and National Trails
Map 4 shows all the theoretical areas from where, at an absolute minimum, a turbine hub of 80 metre height plus its 40 metre blades could be seen. The blades, extending an additional 40 metres will not only be seen at a greater distance, but will also be visible from nearer and otherwise “previously unaffected” receptor areas. (Of course larger turbines will be seen over a greater area.) These theoretical areas are known as Zones of Theoretical Visibility (ZTVs), the term used here. They are also known elsewhere as Zones of Visual Influence, or Zones of Visual Impact, (ZVIs).
As Map 4 shows, significant areas will theoretically be within sight of one or more turbines/wind farms, including receptors and locations well within the boundaries and landscapes of the Brecon Beacons National Park. Over 249,000 hectares (615,000 acres) are likely to be effected by turbines in the 7 Wind LSAs, of which almost 184,000 hectares (455,000 acres) – over 35% of the county including the National Park – is within Powys.
In addition, the ZTV analyses shows around 65,000 hectares (161,000 acres) of the adjacent counties of Herefordshire and Shropshire, including the Shropshire AONB will likewise have potential sight of these turbines. Parts of the Snowdonia National Park are also shown to be impacted, as are large parts of the National Trails that are wholly or partly within Powys.
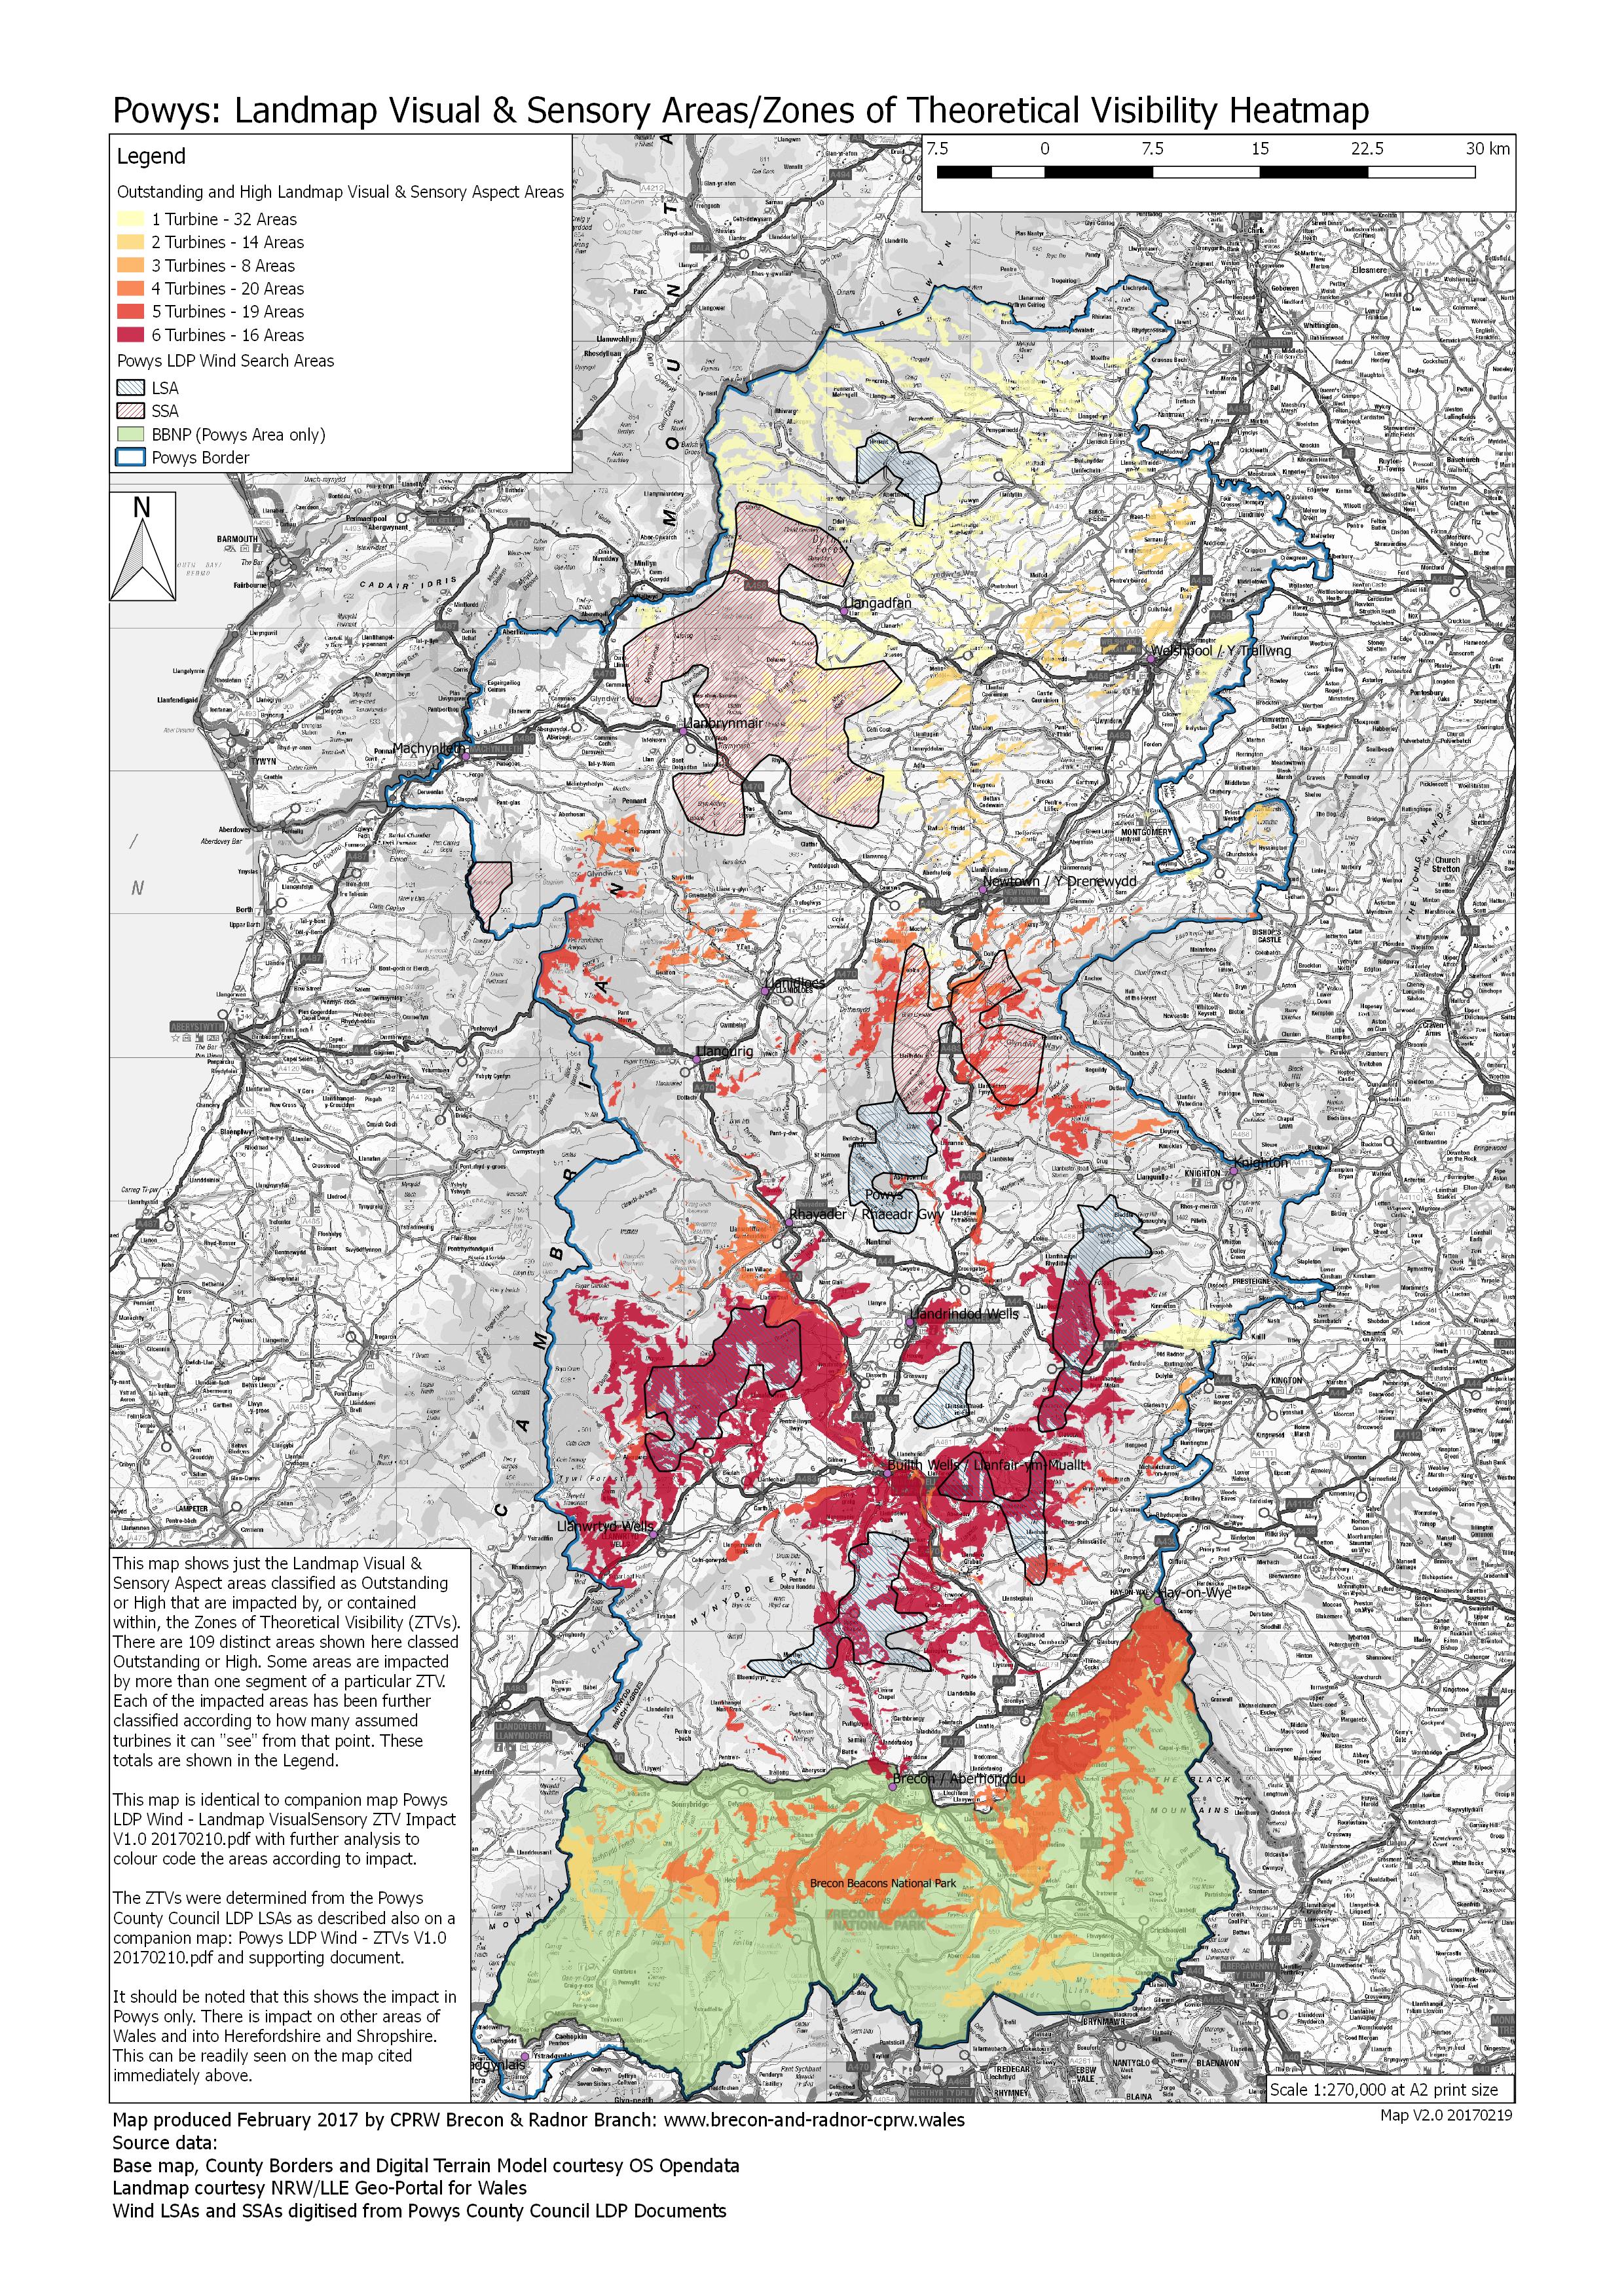
Map 5 Powys LDP Area: LANDMAP Visual & Sensory Areas/Zones of Theoretical Visibility Heatmap
Map 5 is an evolution of Map 4 and shows all the LANDMAP Visual & Sensory Aspect areas in Powys classed as Outstanding or High within these ZTVs, i.e. those important landscape areas within the ZTVs which will be visually impacted by the existence of the turbines.
Each of these Outstanding or High value LANDMAP landscape Visual & Sensory Aspect areas, is then colour coded to show how many LSAs they will be impacted by, i.e. how many of the LSAs with turbines will be visible from that Outstanding or High value landscape area.
As with Maps 2 and 3, the darker the red colouring, the more ZTVs create an impact on that particular LANDMAP Visual & Sensory area.
Further statistical analysis of this information reveals that
- 109 distinct Visual & Sensory Aspect areas classed as Outstanding and High are impacted, comprising over 200,000 hectares (495,000 acres) of Powys
- Almost 100 of these impacted areas are recognised by the baseline LANDMAP data as having this degree of importance because of the “views out of the area”
- 55 of the 109 areas will be able to see turbines from 4 or more LSAs: over 50% of the areas impacted.
Map 5 once again shows the large areas of the BBNP from which it will be possible to see turbines from up to 4 LSAs.
—–
Downloads
You may download full size (variously A2 and A3 size) versions of the maps below. They are large downloads. If you left click on the link they will open in a new browser tab. Alternatively right click and click Save Link As (or equivalent) to save the map to your computer.
Map 1: Powys LDP area: Proposed Wind & Solar Local Search Areas in relation to the Brecon Beacons National Park (13MB – A2 Size)
Map 2: Powys LDP Area: Consolidation of LANDMAP ‘High’ & ‘Outstanding’ Aspect areas for the proposed Wind LSAs (13MB – A2 Size)
Map 3: Powys LDP Area: Consolidation of LANDMAP ‘High’ & ‘Outstanding’ Aspect areas for proposed Solar LSAs (12MB – A2 Size)
Map 4: Powys LDP Area: Wind SAs, Zones of Theoretical Visibility and National Trails (7MB – A3 size)
Map 5: Powys LDP Area: LANDMAP Visual & Sensory Areas/Zones of Theoretical Visibility Heatmap (12MB – A2 Size)
Broken link? Let us know. Thanks.